iOS vs Android App Store Sales Revenue Gap
Research: compare app stores sales between android and iphone. it is well known apps do better on iphone, I want to see sources and a pretty graph with points and all of that though
iOS vs Android App Store Sales: The Revenue Gap Explained
TL;DR. Multiple industry trackers converge on the same picture for 2024: global app-store consumer spending hit roughly $150 billion, and Apple's App Store captured about 68% of it ($102–103 billion) versus roughly 32% ($47 billion) for Google Play — despite Android holding ~70% of the global smartphone install base [1][5][13][18]. On a per-user basis the gap is even starker: iOS users are reported to spend about $10.40/month on apps versus $1.40 on Android, and ARPU on iOS is projected to run 2.5–4× higher in 2025 [1][4].
The headline: iOS earns roughly twice what Google Play does on a fraction of the devices
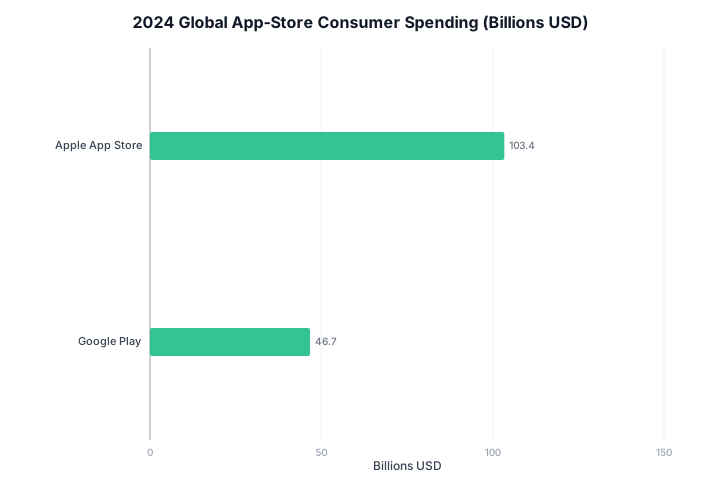
Three independent write-ups citing Sensor Tower / data.ai-style figures land in the same range for 2024. Tekrevol and Appingine both report global app revenue of $150.1 billion, split 68% iOS / 32% Android — about $102B vs $48B [1][5]. Hubifi gives slightly more precise numbers in the same ballpark: $103.4B for the App Store and $46.7B for Google Play in 2024 [13]. Sensor Tower's own "2025 State of Mobile" recap confirms the $150B total and notes it was the first year in-app purchase revenue crossed that threshold, growing 13% year-over-year [18].
Looking forward, Backlinko projects consumer spending on the App Store at $142 billion in 2025 versus $65 billion on Google Play, keeping the split at 68.6% / 31.4% [7]. Appingine cites a similar forward projection of $161B for the App Store and $72B for Google Play [5]. The two forecasts disagree on absolute levels (~$142B vs $161B for iOS in 2025) but agree on the ratio.
A quick comparative chart
Consumer app-store spending, 2024 actuals (billions USD), from [1][5][13][18]:
Global total: $150.1B  ████████████████████████████████████████  100%

Apple App Store   ~$103B  ███████████████████████████▊              68%
   │
   ●──────────────────────────────────────────●
   │
Google Play       ~$47B   █████████████                             32%
   ●───────────●
Per-user monthly app spend [1]:
iOS      $10.40   ██████████████████████████████████████
Android  $1.40    █████
                  (roughly 7× gap on Tekrevol's figure;
                   Ripenapps frames it as 2.5–4× ARPU [4])
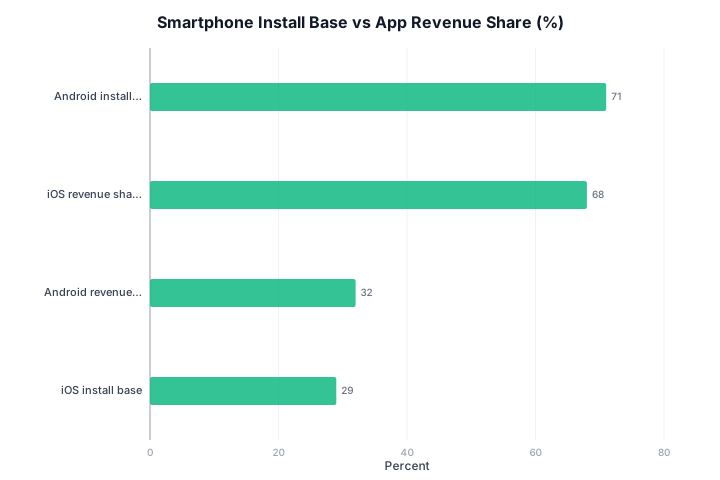
Install base vs revenue share — the inversion that drives the story [1][4][5]:
                Smartphone share       App-revenue share
Android    ████████████████████ ~71%   █████████ 32%
iOS        ████████ ~29%               ███████████████████ 68%
Why the gap exists: monetization model, not just user count
The sources agree the disparity is structural, not incidental. Ripenapps describes iOS users as "conditioned to pay for premium experiences and subscription-based services, whereas Android users prefer free-with-ads models," and notes iOS conversion rates run higher partly because of Apple Pay integration and higher average order values [4]. Tekrevol quantifies the split from the other side: Android relies on ad-based revenue for 98% of free-app earnings, while iOS dominates subscriptions — subscriptions accounted for 73% of $66.8B in 2024 on iOS [1]. An older but consistent data point from App Annie: 98% of Google Play revenue comes from in-app purchases in free-to-download apps, and Hubifi notes 97% of Play Store apps are free to download [8][13].
Two illustrative single-app figures from Tekrevol and Appingine underline the divergence: TikTok reportedly pulls $208M on iOS, while a Google-first product like Google One earns $33M on Android [1][5]. iOS also captures 57% of the premium ($400+) phone segment and 78% of ultra-premium ($1000+), meaning the platform's user base skews wealthier — a demographic fact these blogs cite as the underlying driver [1].
Downloads tell the mirror-image story: Android takes roughly 70% of global downloads while iOS's smaller download volume converts at a higher rate [1]. Sensor Tower puts total 2024 downloads at 136 billion, roughly flat year-over-year [18].
Where the growth is coming from
Sensor Tower attributes most of 2024's growth to non-gaming apps, which grew 23% YoY, versus mobile gaming IAP at $81B and only 4% growth [18]. This matches Tekrevol's emphasis on subscription growth as iOS's engine [1]. Data.ai separately expected mobile game spending specifically to rebound to $111.4B in 2024 after peaking at $115.8B in 2021 and dipping to $107.5B in 2023 — a figure that includes third-party stores and so runs higher than Sensor Tower's App Store + Play-only $81B gaming number [16][18]. AI apps are a small but fast-emerging category at roughly $1.3B in IAP revenue in 2024 [18].
What is contested or uncertain
The 68/32 split is remarkably consistent across [1], [5], [7], and [13], which is both reassuring and a caveat: all of these blogs appear to draw from the same underlying trackers (Sensor Tower, data.ai), so their agreement is not fully independent confirmation. I could not directly verify the primary Statista series [9] because the source text has placeholder "[value]" fields rather than numbers.
A few specific tensions:
- Absolute totals vary. Tekrevol/Appingine say $150.1B total for 2024 [1][5]; Hubifi's App Store + Play sum ($103.4B + $46.7B = $150.1B) matches [13]; Sensor Tower says $150B in IAP specifically [18]. These are close but measure slightly different things (gross consumer spending vs IAP-only).
- 2025 iOS forecasts diverge by ~$20B. Backlinko projects $142B [7], Appingine projects $161B [5]. Neither shows methodology in the excerpts.
- The "iOS spends 7× more per user" claim ($10.40 vs $1.40) from Tekrevol [1] is notably larger than Ripenapps' framing of "2.5–4× higher ARPU" [4]. These may be measuring different things (raw spend vs ARPU normalized differently), but readers should treat the exact multiplier as approximate.
- Apple's own $406B "billings and sales" figure for 2024 [10] is not comparable to the $103B revenue figure — it includes physical goods, ads, and services facilitated by the App Store, over 90% of which Apple takes no commission on. Do not confuse it with app-store consumer spending.
- Sources are mostly SEO-style marketing blogs, not primary research. The one primary-ish source (Sensor Tower [18]) is itself commercial. Independent audits are absent from this evidence set.
Open questions
- How much of the iOS revenue lead is causal (ecosystem, payment friction, subscription defaults) versus demographic (iPhone owners are simply higher-income)? [1] and [4] gesture at both without disentangling them.
- Will regulatory action (EU DMA sideloading, US antitrust) or Google's rumored developer-registration changes [3] compress the gap by 2026–2027?
- Do the third-party Android stores common in China and elsewhere close the real-world revenue gap materially? None of the cited sources address non-Google Android storefronts.
- Given AI-app IAP is only ~$1.3B in 2024 [18], how quickly does that category scale, and does it favor one platform?
Figures
Sources
- Android vs iOS Statistics 2026: Users, Revenue, and Global Trends
- Grok 4.5 | Hacker News
- Keep Android Open
- Android vs. iOS User Behavior: Which Platform Earns More?
- iOS vs Android Statistics: Market Share, Revenue, & Trends
- The relay market powering token resellers and fraud | Hacker News
- iPhone vs. Android User & Revenue Statistics (2026)
- App Annie - 9to5Google
- Global Google Play & Apple App Store app spending 2024| Statista
- App Store in the U.S. facilitated $406B in developer billings and sales in 2024 - Apple
- The State of Open Source AI — v1.0.1 · July 2026
- Irreal | The minds had long ago come up with a proper name for it; they called it the Irreal, but they thought of it as Infinite Fun. That was what they really knew it as. The Land of Infinite Fun. –Iain M. Banks, Excession
- Google Play Store Revenue 2025: The Complete Guide | Hubifi Blog
- Pulsar X3 LHD CRAZYLIGHT Mini trådløs gamingmus (jet black) - Gamingmus
- Logitech PRO 2 Lightspeed Trådløs Gamingmus (sort) - Gamingmus
- Data.ai expects mobile game spending to rebound to $111B in 2024 - GamesBeat
- This was a data center a year ago… Now it's on my desk
- 2025 State of Mobile: Consumers' $150 Billion Spent ...
Generated by tink · sources are web pages; verify anything important.